
Contents |
Introduction to structural design | Statics | Tributary areas | Equilibrium | Reactions | Internal forces | Indeterminate structure | Material properties |
The magnitude of internal forces and bending moments do not, by themselves, give any indication as to whether a particular structural element is safe or unsafe. Instead, the load or moment that an element can safely resist can only be determined when information about the element's cross section and material properties is considered: clearly, a large cross section is stronger than a small one. But "large" in what way? The cross-sectional properties relevant to the determination of structural safety and serviceability are different for tension elements, columns, and beams and are, therefore, discussed more fully in their appropriate context. What follows is a brief overview and summary of the major cross-section properties encountered in structural analysis and design, followed by a discussion of tension, compression, and bending.
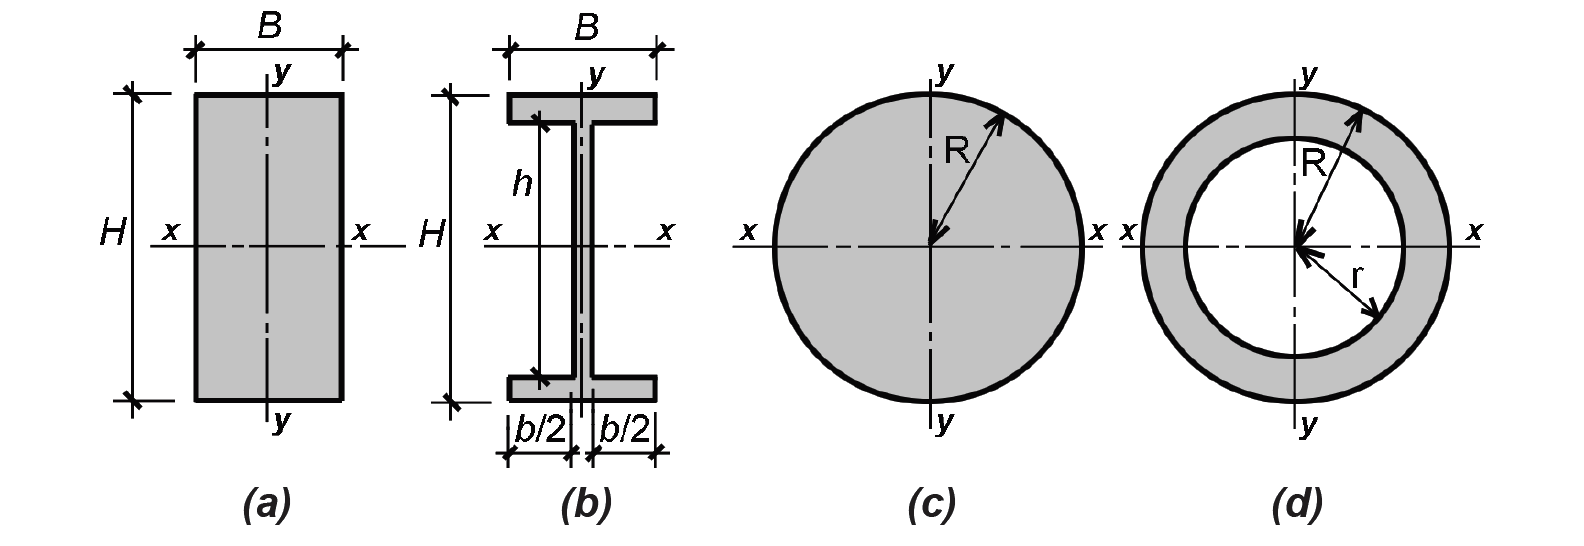
Cross-sectional areas are easily determined: for rectangles, the area A = B × H (Figure 1.49a) and for circles, A = πR2 (Figure 1.49c). What may not be as immediately clear is that the ![]() -shaped cross section (Figure 1.49b) has an area, A = (B × H) – (b × h), and the circular ring (Figure 1.49d) has an area, A = πR2 – πr2, where R is the outer and r is the inner radius.
-shaped cross section (Figure 1.49b) has an area, A = (B × H) – (b × h), and the circular ring (Figure 1.49d) has an area, A = πR2 – πr2, where R is the outer and r is the inner radius.
The moment of inertia, Ix, is defined as the sum of all elemental areas above or below the centroid (x-axis) of the cross section multiplied by the square of the distance from each of the individual elemental centroids to the centroid of the cross section as a whole, or
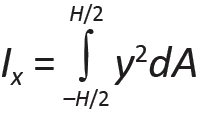
where y is the distance from each elemental area (the elemental areas being dA = width × dy) to the centroid of the cross section, while H/2 and –H/2 represent the limits over which the integral is taken for the rectangle and ![]() -shaped section shown in Figure 1.49 (the same equation holds for the circular sections as well, except with the integral taken from R/2 to –R/2).
This property is useful in understanding the stiffness of a cross section when bent. It can be seen
that placing a good deal of the cross-sectional material away from the centroid — as in the
-shaped section shown in Figure 1.49 (the same equation holds for the circular sections as well, except with the integral taken from R/2 to –R/2).
This property is useful in understanding the stiffness of a cross section when bent. It can be seen
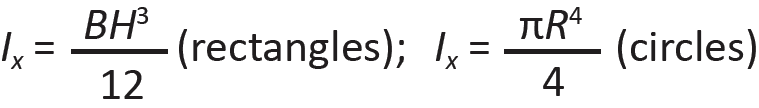
that placing a good deal of the cross-sectional material away from the centroid — as in the ![]() -shaped section or, to a lesser extent, in the circular ring — increases the moment of inertia, and therefore the stiffness, since more "area" is multiplied by the square of a greater distance from the centroidal axis. Equation 1.7 can be solved as follows for rectangular and circular shapes:
-shaped section or, to a lesser extent, in the circular ring — increases the moment of inertia, and therefore the stiffness, since more "area" is multiplied by the square of a greater distance from the centroidal axis. Equation 1.7 can be solved as follows for rectangular and circular shapes:
Moments of inertia for the ![]() -shaped section and circular ring can be easily found by subtracting the smaller rectangle (or circle) from the larger one: for the
-shaped section and circular ring can be easily found by subtracting the smaller rectangle (or circle) from the larger one: for the ![]() -shaped section, Ix = BH3/12 – bh3/12; for the circular ring, Ix = πR4/4 – πr4/4.
-shaped section, Ix = BH3/12 – bh3/12; for the circular ring, Ix = πR4/4 – πr4/4.
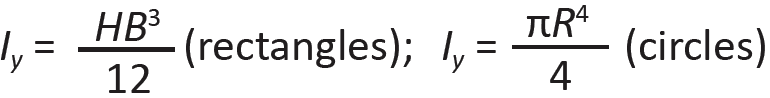
For moments of inertia taken about the y-axis, the equations for rectangles and circles are easily modified:
Moments of inertia for circular rings about the y-axis (Figure 1.49d) are determined as before: by subtracting the moment of inertia of the smaller from that of the larger circle. For moments of inertia of ![]() -shaped sections about the y-axis, however, it is not possible to simply subtract the smaller rectangles from the larger, as was done when computing the moment of inertia about the x-axis, since the centroids of the various parts being subtracted do not coincide.
-shaped sections about the y-axis, however, it is not possible to simply subtract the smaller rectangles from the larger, as was done when computing the moment of inertia about the x-axis, since the centroids of the various parts being subtracted do not coincide.
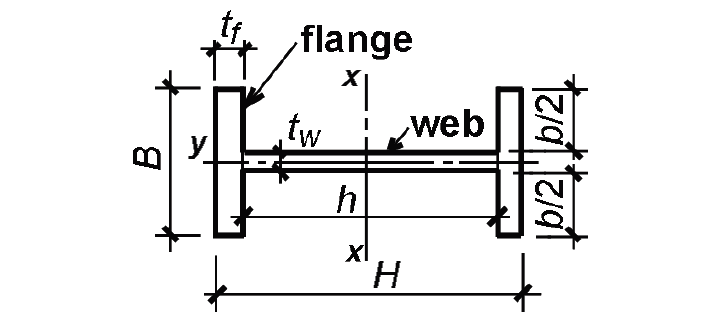
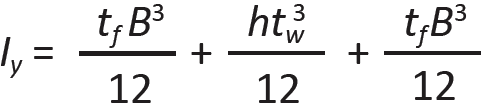
Instead, one must add the three moments of inertia of the two flanges and web, as shown in Figure 1.50, each taken about the y-axis:
The elastic section modulus, Sx, is a single parameter that measures a cross section's strength in bending. For symmetrical sections, such as those shown in Figures 1.49a and 1.49b:
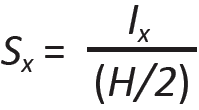
For the circular shapes, Sx = Ix/R (Figures 1.49c and 1.49d). In each case, the moment of inertia is divided by half the cross-sectional height, or thickness. From Equations 1.8 and 1.11, it can be seen that the section modulus for a rectangular cross section is Sx = (BH3/12)/(H/2) = BH2/6.
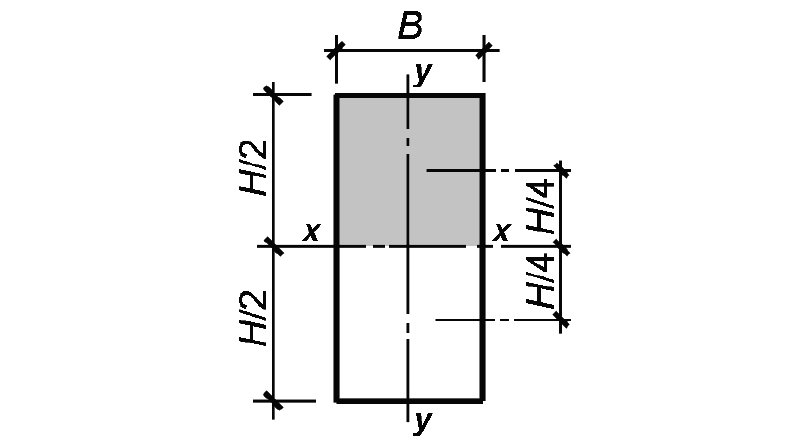
The plastic section modulus, Zx, is used to determine the limit state of steel beams, defined as the point when the entire cross section has yielded. This property is unique to steel, since neither of the other materials we are considering (wood and reinforced concrete) has the necessary ductility to reach this state. Unlike the elastic section modulus, Sx, the plastic section modulus has no fixed relationship to the moment of inertia of the cross section. Rather, it is defined as the sum of all elemental areas above or below the centroid (x-axis) of the cross section multiplied by the distance from each of the individual elemental centroids to the centroid of the cross section as a whole. The plastic section modulus for a rectangular cross section can be determined by multiplying each section half (e.g., the shaded area shown in Figure 1.51) by the distance from its centroid to the centroid for the whole section: Zx = B(H/2)(H/4) + B(H/2)(H/4) = BH2/4.
The radius of gyration of a cross section, r or ρ, is a distance — but one without any obvious physical meaning. It measures the cross section's resistance to buckling, when compressed, and is defined as follows:
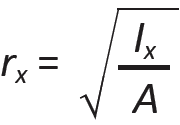
where Ix is the moment of inertia about the x-axis, and A is the cross-sectional area. Since buckling might occur about either of the cross-sectional axes, it is the cross section's smaller radius of gyration, taken about the y-axis (the weaker axis), that is often critical:
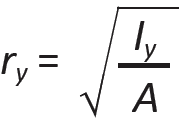
From Equation 1.9, the moment of inertia about the y-axis used to compute the minimum radius of gyration for a rectangular cross section is Iy = HB3/12, where H and B are as shown in Figure 1.49a.
Elements subjected to tension provide us with the simplest mathematical model relating internal force and stress:
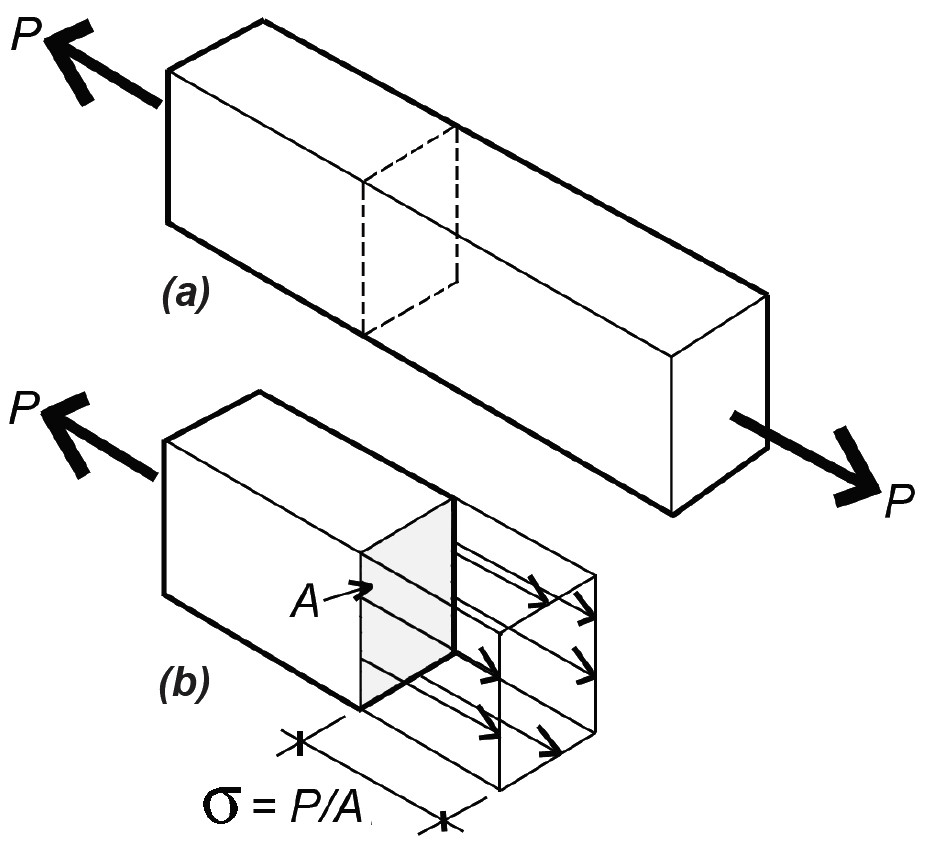
This equation is simple and straightforward because it corresponds to the simplest pattern of strain that can develop within the cross section of a structural element. As shown in Figure 1.52, this strain is assumed to be uniformly distributed across the entire cross section; for this reason, the stress can be defined as force per unit area. Classical "strength of materials" texts use the symbol, σ, for axial stress, so that we get:
where P is the internal force at a cross section with area, A. By axial stress, we mean stress "acting" parallel to the longitudinal axis of the structural element, or stress causing the element to strain in the direction of its longitudinal axis. Tension is an axial stress causing elongation; compression is an axial stress causing shortening or contraction.
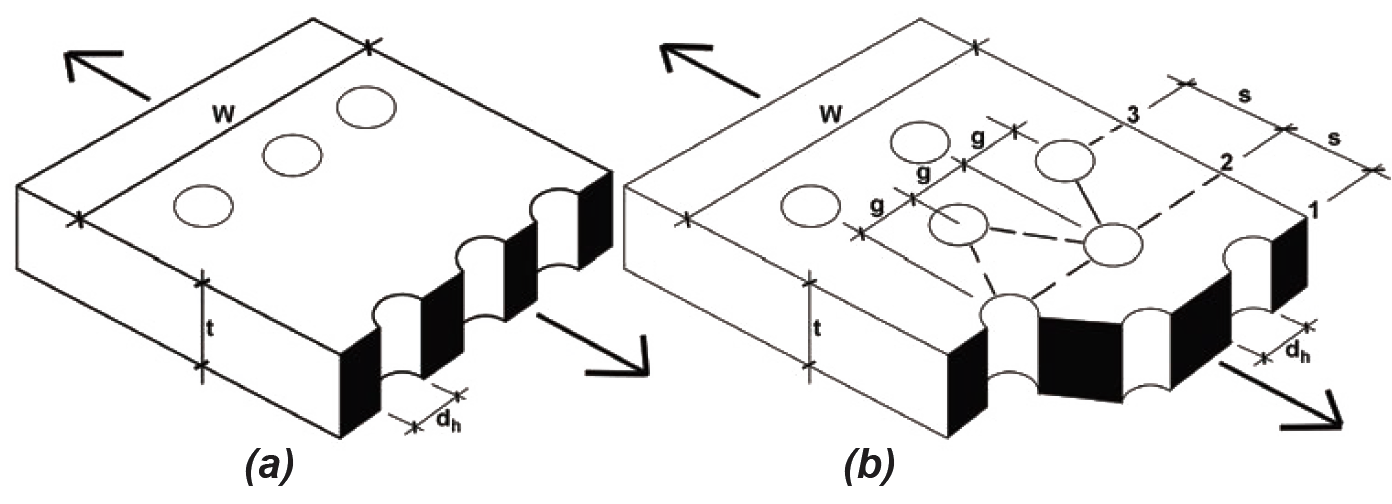
Where bolt holes reduce the cross-sectional area of a tension element, the remaining area at the cross section, An, is called the net area. Failure or "rupture" of an element stressed in tension occurs at a failure surface defined by the location and quantity of such bolt holes. Where the holes are arrayed in an orthogonal grid, as shown in Figure 1.53a, the failure surface is easily determined. For staggered rows of bolts, as shown in Figure 1.53b, more than one possible failure surface may exist: the net area in each case can be determined by multiplying the net width of the section by its thickness, t. This net width is found by subtracting from the gross width, W, the sum of hole diameters, dh, and then adding spacing-gage terms, s2/(4g), for each diagonal line in the failure surface. In these calculations, s is the spacing between bolt centerlines parallel to the direction of load, and g is the "gage," or spacing between bolt centerlines perpendicular to the direction of load.
When we discuss particular structural materials, stresses are often represented by the letter F rather than σ, and capitalized when referring to allowable, yield or ultimate stresses in timber and steel. For example, Fy refers to the yield stress of steel; Fu refers to the ultimate stress of steel (the highest stress, or "strength," of steel reached within the strain-hardening region); while Ft symbolizes allowable tensile stress in both timber and steel. Lowercase f, with appropriate subscripts, is often used to refer to the actual stress being computed. An exception to this convention occurs in reinforced concrete strength design, where the yield stress of reinforcing steel (Fy in steel design) is given a lowercase designation, fy (as is the cylinder strength of concrete, fc') In any case, for axial tension in steel and wood, allowable stress design requires that:
The elongation of an element in tension can be computed based on the definition of modulus of elasticity given in Equation 1.6; since E = σ/ε, and substituting P/A for σ and (elongation)/(original length) for ε, we get:
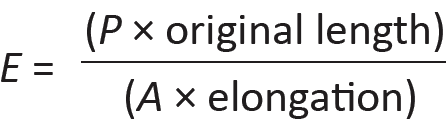
Solving for elongation, and letting L = original length, the equation becomes:
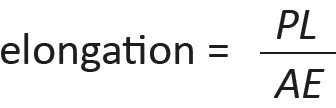
Problem definition. Compute the elongation, or change in length, for a steel bar with a cross-sectional area of 4 in2, 3 ft in length, with E = 29,000,000 psi, subjected to a tensile load of 10 kips.
Solution overview. Find elongation = (PL)/(AE). Units must be consistent.
Problem solution
From Equation 1.18, elongation = (PL)/(AE) = (10 kips × 36 in.)/(4 in2 × 29,000 ksi) = 0.0031 in.
Columns are vertical elements subjected to compressive stress; nothing, however, prevents us from applying the same design and analysis methods to any compressive element, whether vertical, horizontal or inclined. Only axially-loaded compression elements (with no bending moments present) will be considered here.
Compression is similar to tension, since both types of structural action result in a uniform distribution of axial stress over a cross section taken through the element. But allowable stress in compression is often limited by the phenomenon of buckling, in which the element deforms out of its axial alignment at a stress that may be significantly lower than the stress causing compressive crushing.
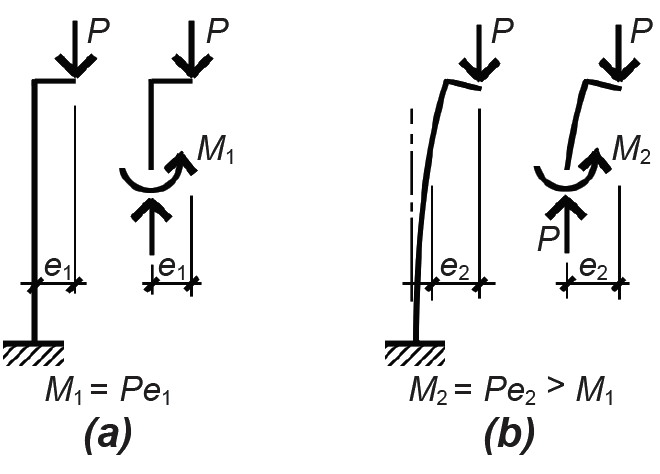
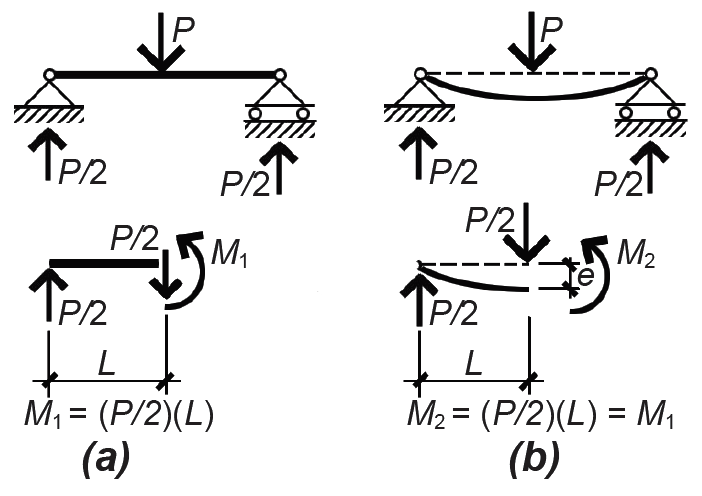
To understand why an axially-loaded column will buckle rather than simply compress, consider the case of an eccentrically-loaded column, as shown in Figure 1.54. Unlike a beam whose internal bending moments are not influenced by load-induced deflections (Figure 1.55), the eccentrically-loaded column will deflect more than might be expected if only the initial moment, M1, is considered, since the "initial deflections" increase bending moments throughout the column, in turn causing further deflection, as shown in Figure 1.54b. What the mathematician Leonard Euler (1707–1783) figured out was that these deflections increase rapidly in the vicinity of a particular ("critical") load, at which point the column is assumed to fail, and that the value of this load is independent of the initial eccentricity. In other words, even with the smallest imaginable deviation from axiality, a column is assumed to buckle at some critical load. Since no perfectly axial columns (or loads) can exist, all columns behaving elastically are assumed to buckle at the critical buckling stress derived by Euler:
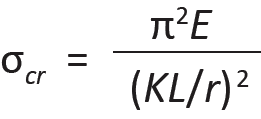
where
E = the modulus of elasticity
K = a coefficient that depends on the column's end constraints (see Appendix Table A-1.2)
L = the unbraced length of the column
r = the radius of gyration with respect to the unbraced length (sometimes given the symbol, ρ), equal to ![]() ,
,
where I is the least moment of inertia and A is area of the cross section
For the typical case in which the unbraced length is the same for both axes of the column, r (or I) is taken as the smaller of the two possible values, i.e., rmin (or Imin). The term L/r, or KL/r, is called the column's slenderness ratio. Although this formulation for buckling is widely used, it is actually an approximation of a more accurate equation derived by Euler which does not indicate any catastrophic buckling point at all. Instead, as may be confirmed by physically buckling a slender piece of wood or other material, the initiation of buckling (at a stress approximated by Equation 1.19) leads to a gradually increasing lateral deflection up until the point of failure, which is initiated when the stresses in the material exceed the material's strength. Certainly, the capacity of such a column is thereby reduced (compared with a hypothetical case in which the column remains perfectly straight), and Euler's approximate formula does give a conservative value for the point at which such failure occurs; however, it is incorrect to imagine the actual behavior of a compression element as failing catastrophically and suddenly at a precise "critical buckling" point.
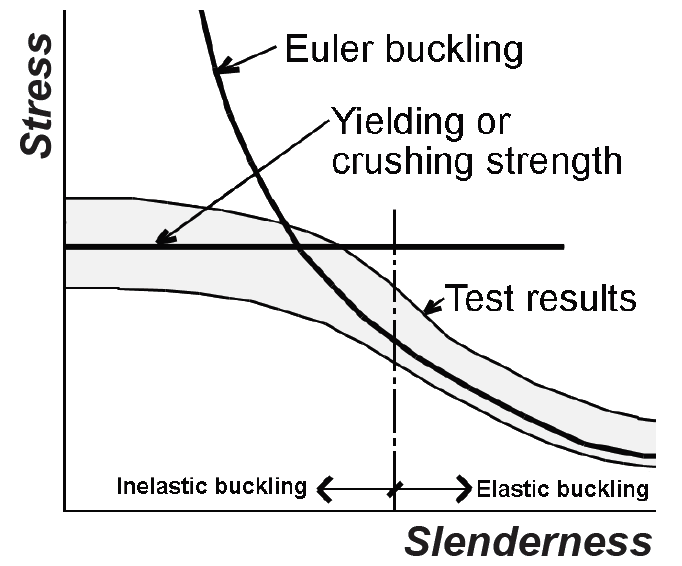
The strength of wood and steel columns is limited in two ways: either they will crush at their maximum compressive stress, or buckle at some critical stress that is different from, and independent of, their strength in compression. Euler's equation for critical buckling stress works well for slender columns, but gives increasingly inaccurate results as the slenderness of columns decreases and the effects of crushing begin to interact with the idealized conditions from which Euler's equation was derived. Figure 1.56 shows schematically the relationship between Euler critical buckling stress, crushing strength, and test results for columns with different slenderness ratios. It can be seen that only for slender columns can the Euler curve be used as a basis for design.
Like all structural elements, beams are both stressed and subject to deformations when loaded. Both of these considerations must be accounted for in the design of beams.
Deflection. While the elongation or contraction of axially-loaded members along their longitudinal axes is usually of little consequence, beams may experience excessive deflection perpendicular to their longitudinal axes, making them unserviceable. Limits on deflection are based on several considerations, including minimizing vibrations, thereby improving occupant comfort; preventing cracking of ceiling materials, partitions, or cladding supported by the beams; and promoting positive drainage (for roof beams) in order to avoid ponding of water at midspan. These limits are generally expressed as a fraction of the span, L (Appendix Table A-1.3). Formulas for the calculation of maximum deflection are included in the appendices for the wood and steel chapters, while values for recommended minimum beam depth are included in the appendix for reinforced concrete. The maximum (midspan) deflection, Δ, of a uniformly loaded simple span can also be found from the equation:
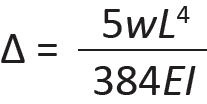
where w = distributed load (lb/in. or kips/in.); L = span (in.); E = modulus of elasticity (psi or ksi); and I = moment of inertia (in4). When using Equation 1.20 with L in feet, w in lb/ft or kips/ft, E in psi or ksi (compatible with load, w), and I in in4, as is most commonly done, multiply the expression by 123 to make the units consistent.
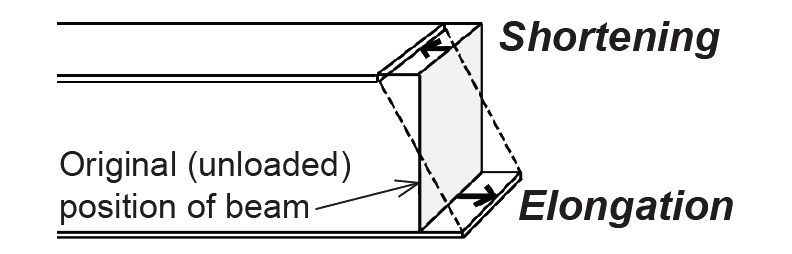
Bending stress. Beams are stressed when they bend because the action of bending causes an elongation on one side, resulting in tension, and a shortening on the other side, resulting in compression. By exaggerating the curvature of the beam as it bends, this elongation and shortening can be visualized. Exactly where the tension and compression are depends on how the beam is loaded and how it is supported.
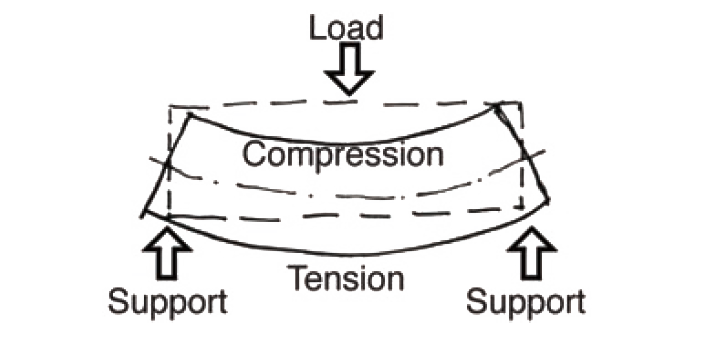
For simply-supported beams with downward-acting loads (i.e., with gravity loads), the beam is stretched on the bottom (tension) and shortened on the top (compression) as shown in Figure 1.57.
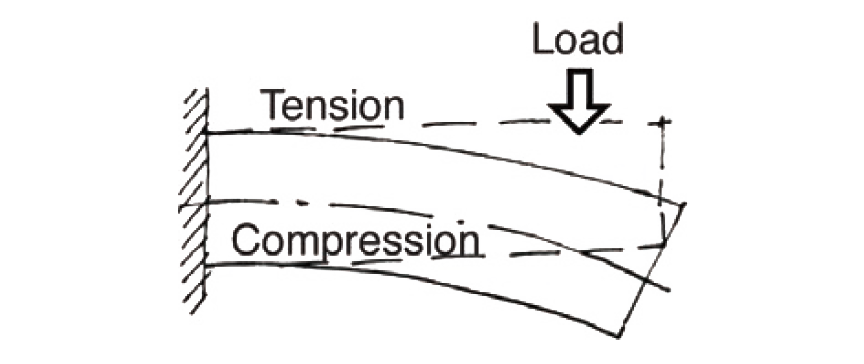
For cantilevered beams fixed at one end, with downward-acting loads, the beam is stretched on the top and shortened on the bottom (Figure 1.58).
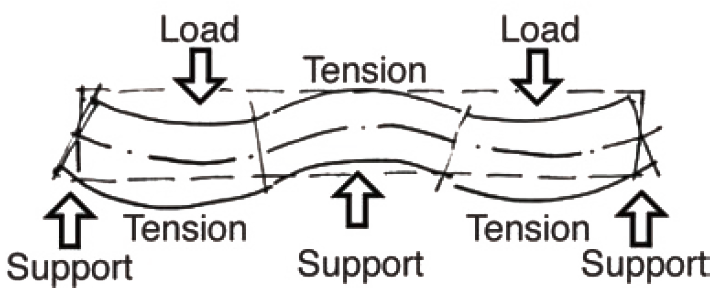
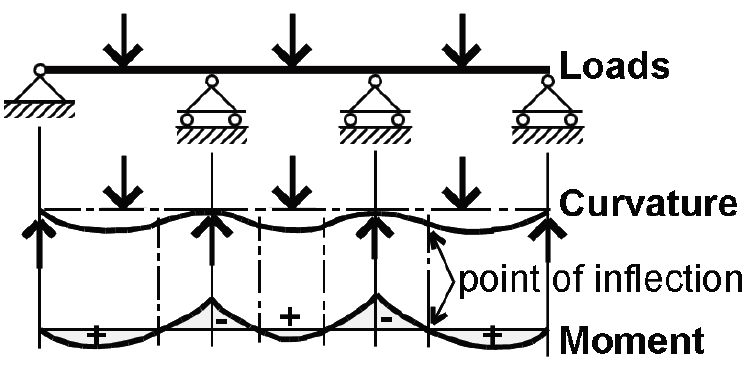
For continuous beams spanning over several supports, the changing curvature causes the position of tension and compression zones to reverse a number of times over the length of the beam, as illustrated in Figure 1.59.
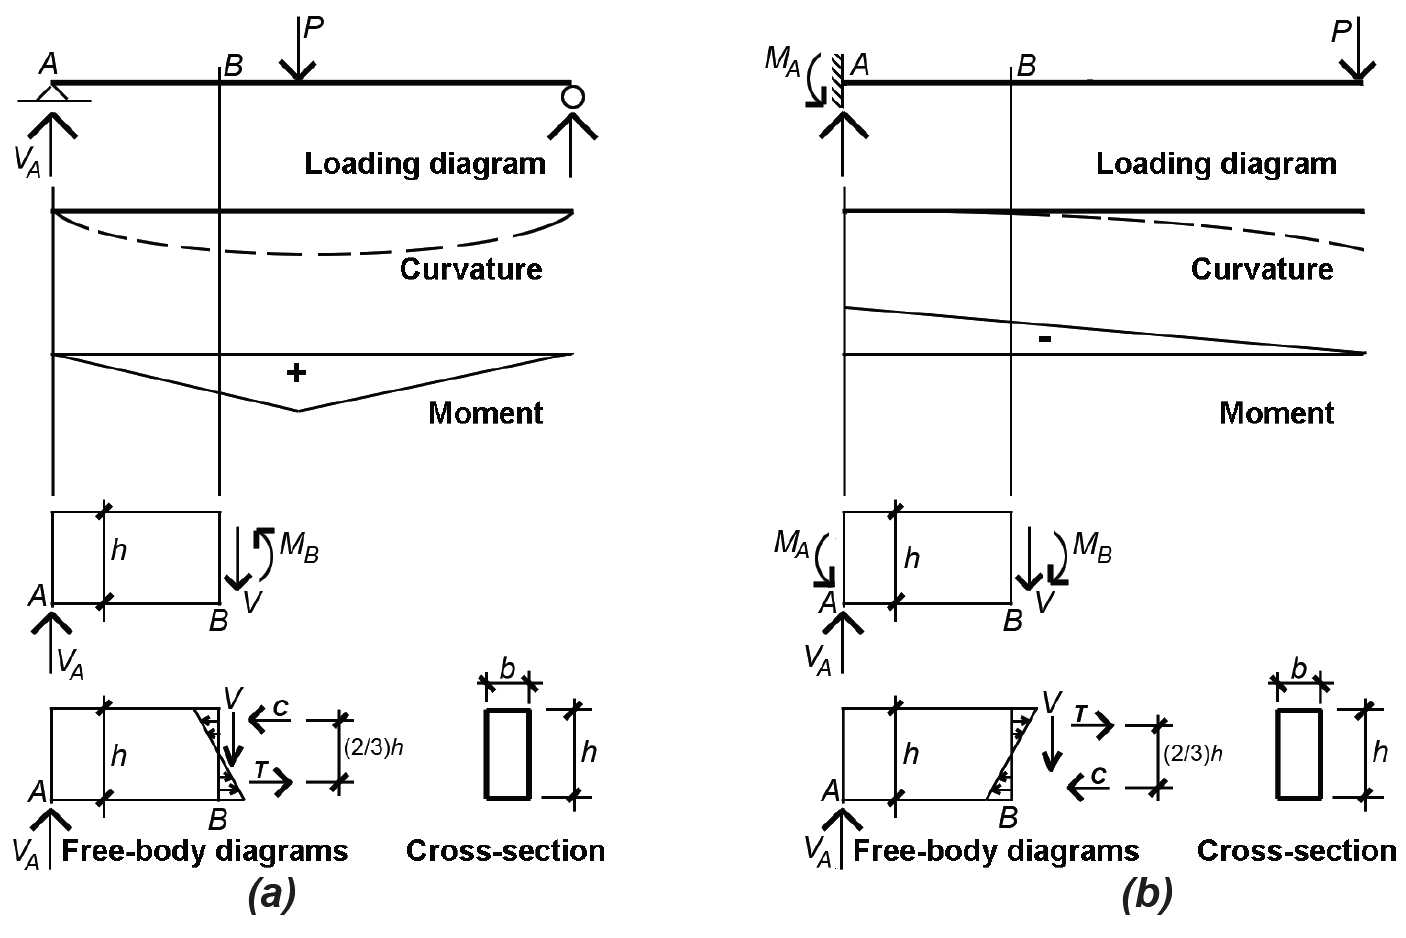
The relative position of tension and compression within the beam's cross section is directly related to the sign of the bending moment at that cross section. As can be seen from Figure 1.60a, a counterclockwise moment on the right side of a free-body diagram is equivalent to a distribution of bending stress with compression on the top and tension on the bottom of the beam: so-called "positive" bending (and "positive" bending moment). Figure 1.60b shows a free-body diagram cut through a cantilever beam with "negative" bending — i.e., tension on the top and compression on the bottom corresponding to a clockwise moment as shown. The reversing curvature of a continuous beam, such as that shown in Figure 1.59, corresponds precisely to a reversal in the sign of the bending moment.
As shown in Figure 1.61, points of inflection (points where the curvature changes) always occur at points of zero moment.
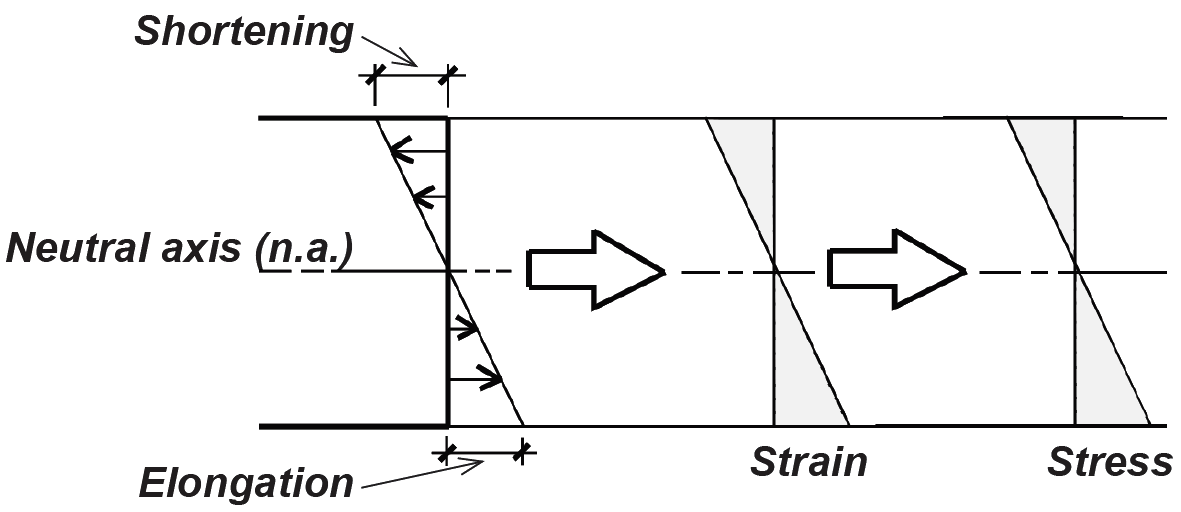
Bending stresses within these beams can be computed if we assume that the stretching and shortening that take place at any cross section are linear; i.e., a straight line connecting a stretched point with a shortened point on any cross-sectional cut will accurately describe the shape of the beam throughout the entire cross section (Figure 1.62).
Three observations can be made, once this assumption is accepted: (1) maximum elongation and shortening occur at the top and bottom of the beam (the "extreme fibers"); (2) a surface exists somewhere between the extreme fibers that is neither elongated nor shortened — this "plane" is called the "neutral axis" or "neutral surface"; and (3) strain can be defined as the elongation or shortening of any portion of the beam, divided by its original (unloaded) length. Since the original length is a constant, a strain diagram has the same shape as an "elongation-shortening diagram." For materials with linear stress-strain relationships (where stress equals strain times a constant modulus of elasticity), a stress diagram will also have the same shape as the strain or "elongation-shortening diagram." Figure 1.63 compares these diagram shapes for materials with linear stress-strain relationships.
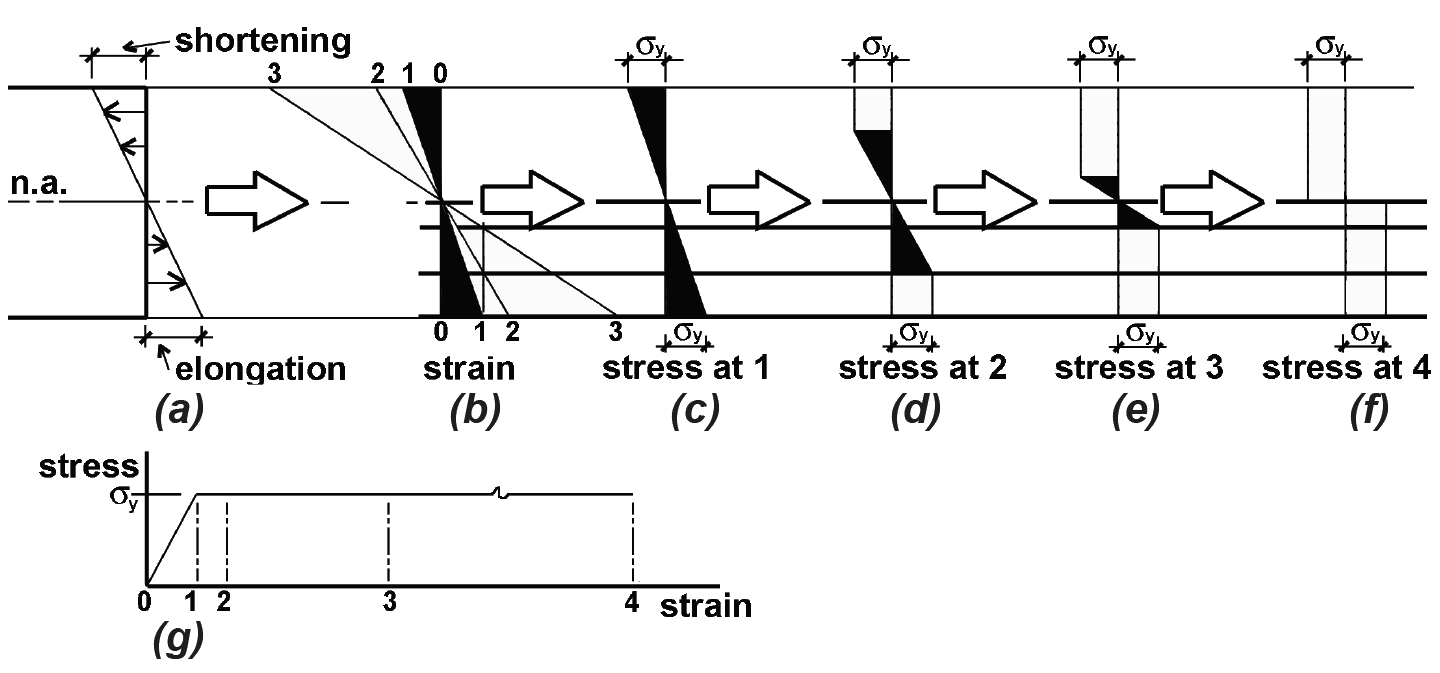
For materials with nonlinear stress-strain relationships, a stress diagram can be pieced together by plotting points from a stress-strain curve for the material. Thus, a steel beam stressed beyond its elastic region would have stress and strain distributions as shown in Figure 1.64. The elongation and shortening, shown in Figure 1.64a, and therefore the strain, shown in Figure 1.64b, is assumed to remain linear even when the stress, shown in Figure 1.64d through Figure 1.64f, becomes nonlinear. In Figure 1.64c, the stress at the extreme fibers of the cross section just reaches the limit of elastic behavior (with stress, σy) which corresponds to the so-called elastic moment, Me. In Figure 1.64f, the strain at the outer fiber is extremely large (theoretically infinite), and the entire cross section is assumed to have yielded at the stress σy, i.e., moved past the linear-elastic yield strain labeled "1" in Figure 1.64g. This condition represents the limit state for a steel beam, and corresponds to the so-called plastic moment, Mp. For reinforced concrete, a nonlinear stress-strain relationship is most often assumed for design; special procedures have been developed to simplify the construction of these stress diagrams.
The shape of the stress diagram is a key element in determining the magnitudes of stresses within the beam: when combined with the cross-sectional shape, the requirements of equilibrium can be used to find the magnitudes of the stresses. Typical stress diagrams are shown in Figure 1.65 corresponding to the allowable moment for wood and the limit states for steel and reinforced concrete.
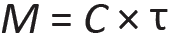
Allowable stress design. As an example of how the stress-moment relationship is computed using the allowable stress design method, consider a free-body diagram cut from a rectangular cross section of width, b, and height, h (assuming a linear stress-strain relationship resulting in a linear stress diagram), as shown in Figure 1.65a. From the requirements of horizontal equilibrium, the total compressive force, C, must equal the total tension force, T. For this to occur, the neutral axis must be at the center of the beam, and the maximum compressive stress must equal the maximum tension stress. Any other linear distribution of stresses would be inconsistent with these requirements of equilibrium. The couple of equal and opposite forces represented by C and T, multiplied by the moment arm between them, must equal the bending moment, M, caused by the loads acting on the beam. The basic bending stress equation derives from this simple fact: M equals C (or T) times the moment arm, τ; that is:
Accounting for beam width, b, C = (1/2)(Fb)(h/2)(b) and τ = (2/3)(h); substituting these values into Equation 1.21, we get:
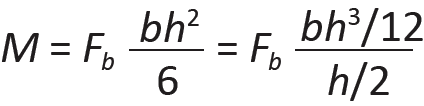
Defining "bh2/6" as the section modulus, S, and "bh3/12" as the moment of inertia, I, for a rectangular cross section, and solving for the maximum allowable stress, Fb, we get the basic bending stress equations for allowable stress design:
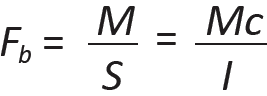
where Fb is the allowable bending stress for the material (psi or ksi), M is the bending moment (in-lb or in-kips), S is the required section modulus (in3); I is the required moment of inertia (in4), and c = h/2 is the distance from the neutral axis to the extreme fiber (in.).
Stress-moment relationships. Equation 1.23 shows the relationship between bending stress, bending moment, and section modulus for a material stressed within its linear-elastic range. It is the basis for wood beam design. Steel and reinforced concrete, however, are no longer designed on the basis of assumed linear-elastic behavior. Even so, the basic relationship between moment, stress, and some sort of section modulus property remains essentially the same for all three materials, as can be seen by comparing the stress and resultant force diagrams shown in Figure 1.65.
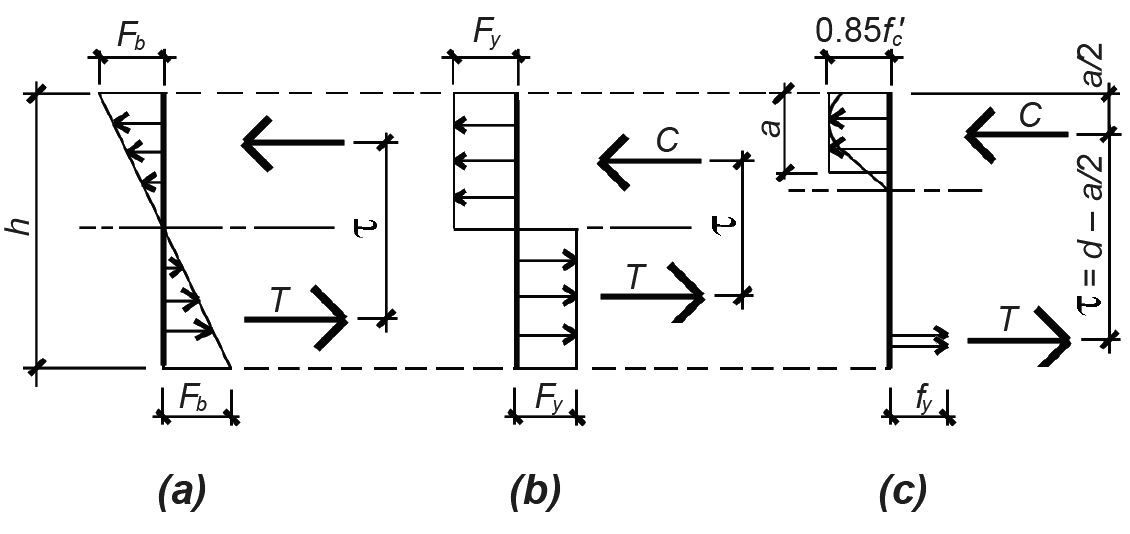
While specific derivations will be covered in the chapters that follow, the requirements of horizontal equilibrium (C = T) and rotational equilibrium (M = C × τ = T × τ) lead to design equations with essentially the same form for all three materials: Equation 1.24 (solving for the required section modulus, S, in Equation 1.23) applies to allowable stress design in wood; Equation 1.25 to allowable strength design in steel; and Equation 1.26 to strength design in reinforced concrete.
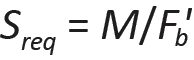
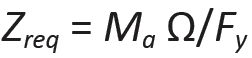
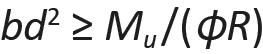
In each case, the section modulus term (S, Z, or bd2) must be greater or equal to the bending moment divided by a bending stress term. The stress terms in Equations 1.24, 1.25, and 1.26 vary: for wood, an adjusted allowable stress, Fb', is used directly; for steel, the yield stress, Fy, is used; for reinforced concrete, the stress term, R, is more complex as it must account for the limit state of both concrete (in compression) and steel (in tension), as well as the ratio of steel to gross area within the beam cross section. Factors of safety are also handled differently for the three materials: in wood "allowable stress" design, the factor of safety is hidden within the stress term, Fb'; in steel "allowable strength" design, the factor of safety, Ω (normally 1.67 for bending), is applied, not to the stress, but to the plastic moment capacity of the cross section in order to determine its "available strength"; in reinforced concrete "strength" design, the factor of safety, φ (normally 0.9 for bending), is a strength reduction factor applied to the moment capacity of the section. Load safety factors are also included within the reinforced concrete design moment, Mu.
The triangular stress distribution in allowable stress design for wood corresponds to the elastic section modulus, S = bd2/6, defined in Equation 1.22 for rectangular cross sections. For steel, the plastic section modulus, Z, is used, and is equal to bd2/4 for a rectangular section — this is easily derived from the equilibrium of stresses shown in Figure 1.65b, although it should be noted that rectangular solid shapes are virtually nonexistent in steel beams. The term, bd2, used in reinforced concrete Equation 1.26, has no official status as a "section modulus," yet it consists of the same basic variables and has the same units as wood's S and steel's Z.
Bending design methods. Equations 1.24, 1.25, and 1.26 are "design" equations, since they provide guidance for the size and shape of bending elements that are capable of resisting a given bending moment. In practice, after bending moments are determined (for example, by the construction of load, shear, and moment diagrams; from moment value tables; or with the use of structural analysis software), the required section modulus term is calculated, and a cross section is then selected. In the case of wood and steel, tables of standard cross sections and their corresponding section moduli facilitate the direct selection of appropriate shapes. The design of a reinforced concrete beam is less direct, since the ratio of steel to concrete may vary, producing a range of acceptable bd2 terms, each of which may sponsor a range of choices for cross-sectional dimensions b and d.
Shear stress. Internal forces perpendicular to the longitudinal axis of beams may also exist along with bending moments at any cross section, consistent with the requirements of equilibrium (see, for example, the force V shown in the free-body diagrams within Figure 1.60). These shear forces are distributed over the cross-sectional surface according to the equation:
where τ = shear stress at a distance, y, from the extreme fiber (psi or ksi); V is the total shear force at the cross section (lb or kips); Q is the "static moment" of the partial cross-sectional area (from the extreme fiber to the distance, y) about the neutral axis of the cross section (in3); I is the moment of inertia of the cross section (in3); and b is the width of the cross section at a distance, y, from the extreme fiber (in.).
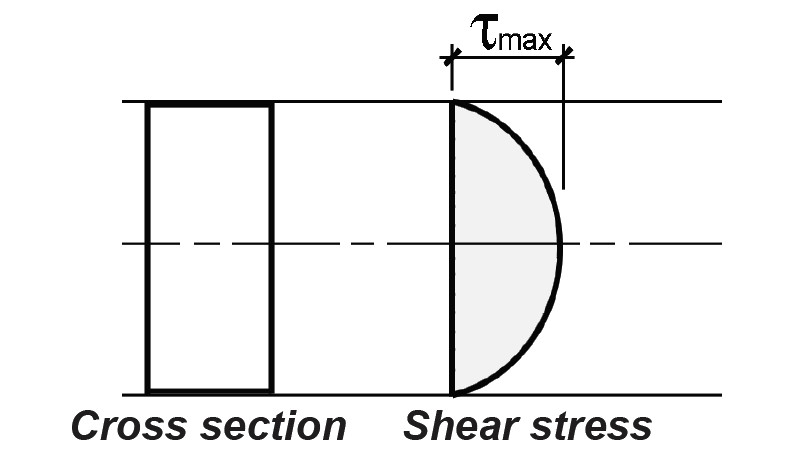
Rectangular sections. For rectangular cross sections, the maximum shear stress, which occurs at the neutral axis, becomes:
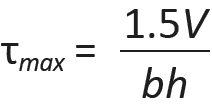
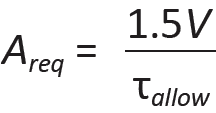
where h is the height of the rectangular cross section; all other variables are as defined above for Equation 1.27. Alternatively, one can solve for the required cross-sectional area, Areq = bh (in2) as the basis for designing or analyzing a rectangular beam for shear, corresponding to an allowable shear stress, τallow (psi or ksi) for maximum shear force, V (lb or kips). In this case, one gets:
This is the basis for checking shear in timber beams, which are almost always rectangular (Figure 1.66). Reinforced concrete beams behave in a more complex manner, and special procedures for dealing with shear, or diagonal tension, have been developed.
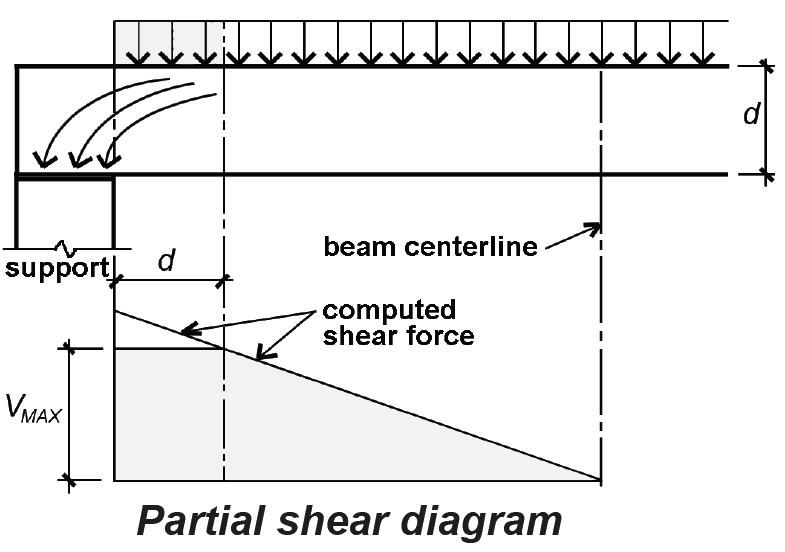
In the vicinity of supports, loads are transferred by compression directly to those supports (Figure 1.67), and the maximum shear force is therefore somewhat less than the computed maximum value. In the design of wood and reinforced concrete beams, the shear force within a distance, d, of the face of the supports can be considered equal to the value of the shear force at that distance, d. For wood beams, d is the total beam height; for reinforced concrete, it represents the effective depth, measured to the centerline of the tension reinforcement.
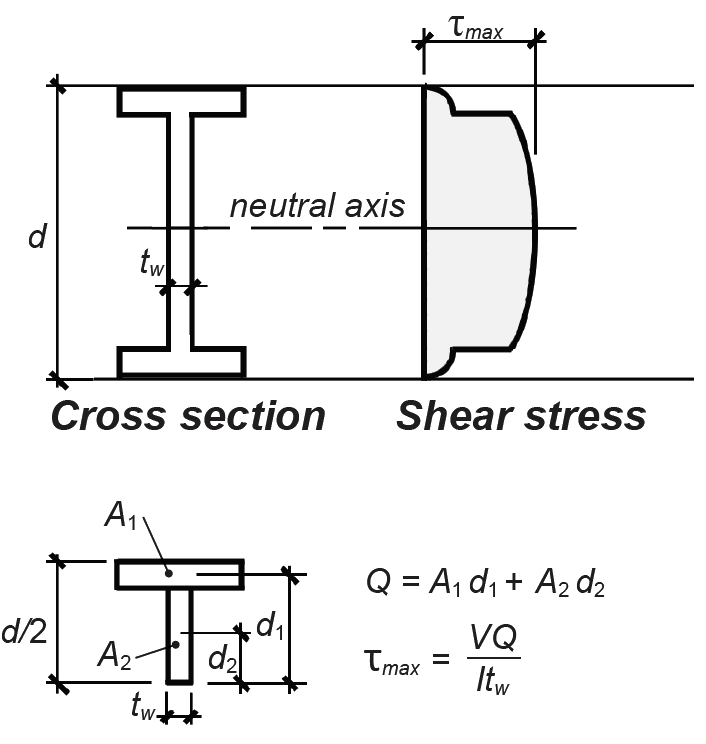
Wide-flange sections. For steel wide-flange sections, the maximum shear stress, also at the neutral axis, can be found by computing the static moment, Q, of the partial area (above the neutral axis) about the neutral axis and solving Equation 1.27, as shown in Figure 1.68.
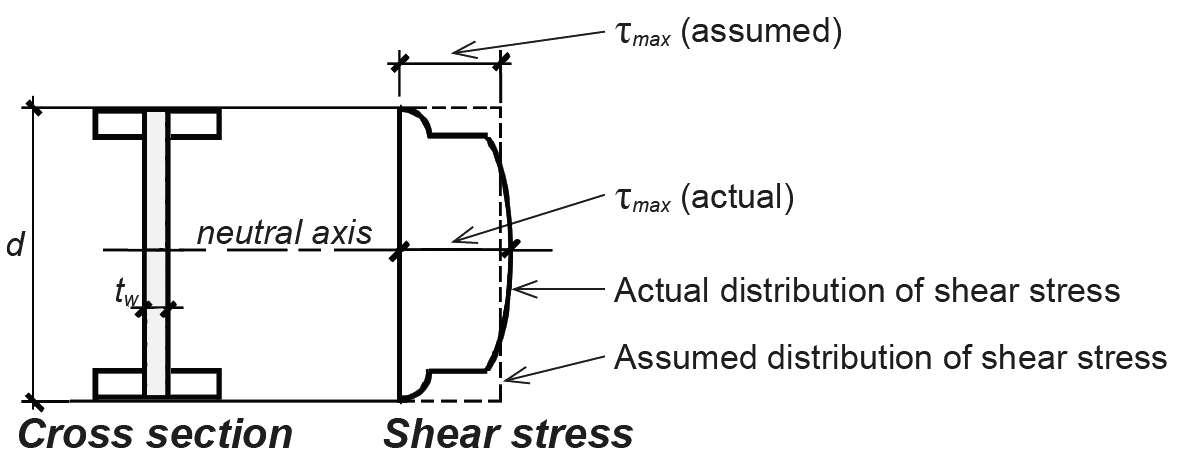
For steel wide-flange shapes, simplified procedures have been developed, based on the average stress on the cross section, neglecting the overhanging flange areas; that is:
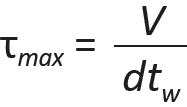
where τmax = the maximum shear stress within the cross section, V = the total shear force at the cross section, d = the cross-sectional depth, and tw = the web thickness (see Figure 1.69).
© 2020 Jonathan Ochshorn; all rights reserved. This section first posted November 15, 2020; last updated November 15, 2020.